Preface
This open-access textbook is, and will remain, freely available for everyone’s enjoyment (also in PDF; a paper copy can also be ordered). It is a non-profit project. Although available online, it is a whole course, and should be read from the beginning to the end. Refer to the Preface for general introductory remarks. Any bug/typo reports/fixes are appreciated. Make sure to check out Minimalist Data Wrangling with Python [28], too.
To R, or not to R
R has been named the eleventh most dreaded programming language in the 2022 StackOverflow Developer Survey.
Also, it is a free app, so there must be something wrong with it, right?
But whatever, R is deprecated anyway; the modern way is to use tidyverse.
Or we should all just switch to Python.
Yeah, nah.
R (GNU S) as a language and an environment
Let’s get one[1] thing straight: R is not just a statistical package. It is a general-purpose, high-level programming language that happens to be very powerful for numerical, data-intense computing activities of any kind. It offers extensive support for statistical, machine learning, data analysis, data wrangling, and data visualisation applications, but there is much more.
As we detail below, R has a long history. It is an open-source version of the S environment, which was written for statisticians, by statisticians. Therefore, it is a free, yet often more capable alternative to other software (but without any strings attached). Unlike in some of them, in R, a spreadsheet-like GUI is not the main gateway for performing computations on data. Here, we must write code to get things done. Despite the beginning of the learning curve’s being a little steeper for non-programmers, in the long run, R empowers us more because we are not limited to tackling the most common scenarios. If some functionality is missing or does not suit our needs, we can easily (re)implement it ourselves.
R is thus very convenient for rapid prototyping. It helps turn our ideas into fully operational code that can be battle-tested, extended, polished, run in production, and otherwise enjoyed. As an interpreted language, it can be executed not only in an interactive read-eval-print loop (command–result, question–answer, …), but also in batch mode (running standalone scripts).
Therefore, we would rather position R amongst such environments for numerical or scientific computing as Python with numpy and pandas, Julia, GNU Octave, Scilab, and MATLAB. However, it is more specialised in data science applications than any of them. Hence, it provides a much smoother experience. This is why, over the years, R has become the de facto standard in statistics and related fields.
Important
R is a whole ecosystem. Apart from the R language interpreter, it features advanced:
graphics capabilities (see Chapter 13),
a consistent, well-integrated help system (Section 1.4),
ways for convenient interfacing with compiled code (Chapter 14),
a package system and centralised package repositories (such as CRAN and Bioconductor; Section 7.3.1),
a lively community of users and developers – curious and passionate people, like you and yours cordially.
Note
R [71] is a dialect of the very popular S system designed in the mid-1970s by Rick A. Becker, John M. Chambers, and Allan R. Wilks at Bell Labs. For historical notes, see [3, 4, 5, 6]. For works on newer versions of S, refer to [7, 10, 14, 58]. Quoting from [4]:
The design goal for S is, most broadly stated, to enable and encourage good data analysis, that is, to provide users with specific facilities and a general environment that helps them quickly and conveniently look at many displays, summaries, and models for their data, and to follow the kind of iterative, exploratory path that most often leads to a thorough analysis. The system is designed for interactive use with simple but general expressions for the user to type, and immediate, informative feedback from the system, including graphic output on any of a variety of graphical devices.
S became popular because it offered greater flexibility than the standalone statistical packages. It was praised for its high interactivity and array-centrism that was taken from APL, the familiar syntax of the C language involving {curly braces}, the ability to treat code as data known from Lisp (Chapter 15), the notion of lazy arguments (Chapter 17), and the ease of calling external C and Fortran routines (Chapter 14). Its newer versions were also somewhat object-orientated (Chapter 10).
However, S was a proprietary and closed-source system. To address this, Robert Gentleman and Ross Ihaka of the Statistics Department, University of Auckland developed R in the 1990s[2]. They were later joined by many contributors[3]. It has been decided that it will be distributed under the terms of the free GNU General Public License, version 2.
In essence, R was supposed to be backwards-compatible with S, but some design choices led to their evaluation models’ being slightly different. In Chapter 16, we discuss that R’s design was inspired by the Scheme language [1].
Aims, scope, and design philosophy
Many users were introduced to R by means of some very advanced operations involving data frames, formulae, and functions that rely on nonstandard evaluation (metaprogramming), like:
lm(
    Ozone~Solar.R+Temp,
    data=subset(airquality, Temp>60, select=-(Month:Day))
) |> summary()
This is horrible.
Another cohort was isolated from base R through a thick layer of popular third-party packages that introduce an overwhelming number of functions (every operation, regardless of its complexity, has a unique name). They often duplicate the core functionality, and might not be fully compatible with our traditional system.
Both user families ought to be fine, as long as they limit themselves to solving only the most common data processing problems.
But we yearn for more. We do not want hundreds of prefabricated recipes for popular dishes that we can mindlessly apply without much understanding.
Our aim is to learn the fundamentals of base R, which constitutes the lingua franca of all R users. We want to be able to indite code that everybody should understand; code that will work without modifications in the next decades, too.
We want to be able to tackle any data-intense problem. Furthermore, we want to develop transferable skills so that learning new tools such as Python with numpy and pandas (e.g., [28, 48]) or Julia will be much easier later. After all, R is not the only notable environment out there.
Anyway, enough preaching. This graduate[4]-level textbook is for readers who:
would like to experience the joy of solving problems by programming,
want to become independent users of the R environment,
can appreciate a more cohesively and comprehensively[5] organised material,
do not mind a slightly steeper learning curve at the beginning,
do not want to be made obsolete by artificial “intelligence” in the future.
Some readers will benefit from this book’s being their first introduction to R (yet, without all the pampering). For others[6], this will be a fine course from intermediate to advanced (do not skip the first chapters, though).
Either way, we should not forget to solve all the prescribed exercises.
Good luck!
Classification of R data types and book structure
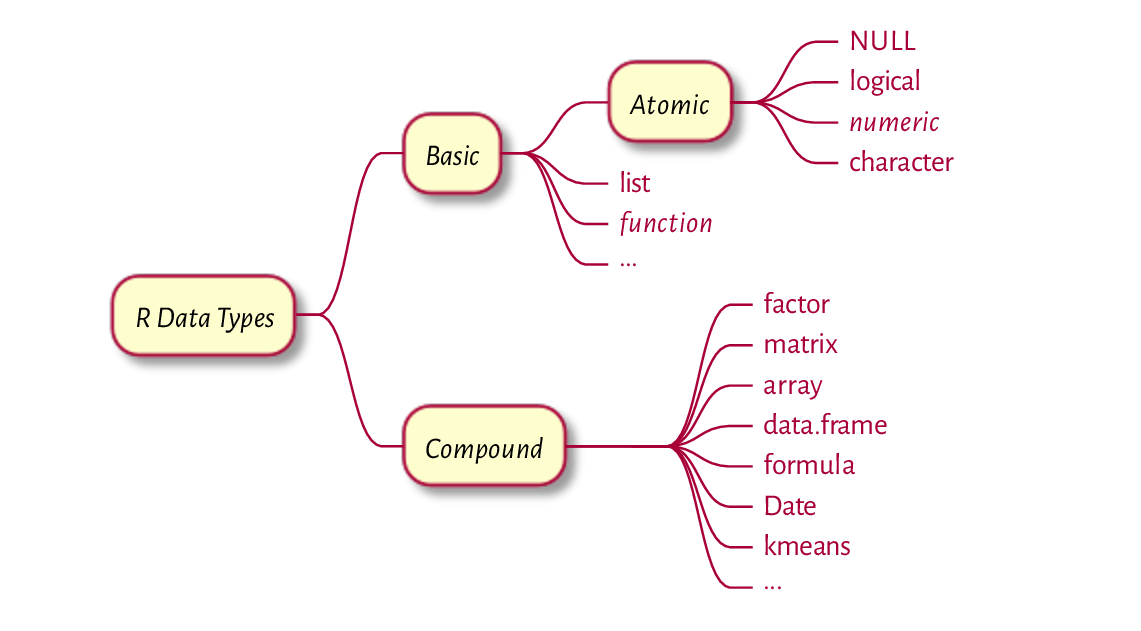
Figure 1 An overview of the most prevalent R data types; see Figure 17.2 for a more comprehensive list.
The most commonly used R data types can be classified as follows; see also Figure 1.
Basic types are discussed in the first part of the book:
atomic vectors represent whole sequences of values, where every element is of the same type:
logical(Chapter 3) includes items that areTRUE(“yes”, “present”),FALSE(“no”, “absent”), orNA(“not available”, “missing”);numeric(Chapter 2) represents real numbers, such as1,3.14,-0.0000001, etc.;character(Chapter 6) contains strings of characters, e.g.,"groß","123", or “Добрий день”;
function(Chapter 7) is used to group a series of expressions (code lines) so that they can be applied on miscellaneous input data to generate the (hopefully) desired outcomes, for instance, cat, print, plot, sample, and sum;list(generic vector; Chapter 4) can store elements of mixed types.
The above will be complemented with a discussion on vector indexing (Chapter 5) and ways to control the program flow (Chapter 8).
Compound types are mostly discussed in the second part. They are wrappers around objects of basic types that might behave unlike the underlying primitives thanks to the dedicated operations overloaded for them. For instance:
factor(Section 10.3.2) is a vector-like object that represents qualitative data (on a nominal or an ordered scale);matrix(Chapter 11) stores tabular data, i.e., arranged into rows and columns, where each cell is usually of the same type;data.frame(Chapter 12) is also used for depositing tabular data, but this time such that each column can be of a different type;formula(Section 17.6) is utilised by some functions to specify supervised learning models or define operations to be performed within data subgroups, amongst others;and many more, which we can arbitrarily define using the principles of S3-style object-orientated programming (Chapter 10).
In this part of the book, we also discuss the principles of sustainable coding (Chapter 9) as well as introduce ways to prepare publication-quality graphics (Chapter 13).
More advanced material is discussed in the third part. For most readers, it should be of theoretical interest only. However, it can help gain a complete understanding of and control over our environment. This includes the following data types:
symbol(name),call,expression(Chapter 15) are objects representing unevaluated R expressions that can be freely manipulated and executed if needed;environment(Chapter 16) store named objects in hash maps and provides the basis for the environment model of evaluation;externalptr(Section 14.2.8) provides the ability to maintain any dynamically allocated C/C++ objects between function calls.
We should not be surprised that we did not list any data types defined by a few trendy[7] third-party packages. We will later see that we can most often do without them. If that is not the case, we will become skilled enough to learn them quickly ourselves.
Acknowledgements
R, and its predecessor S, is the result of a collaborative effort of many programmers. Without their generous intellectual contributions, the landscape of data analysis would not be as beautiful as it is now. R is distributed under the terms of the GNU General Public License version 2. We occasionally display fragments of its source code for didactic purposes.
We describe and use R version 4.5.2 (2025-10-31). However, we expect 99.9% of the material covered here to be valid in future releases (consider filing a bug report if you discover this is not the case).
Deep R Programming is based on the author’s experience as an R user (since ~2003), developer of open-source packages, tutor/lecturer (since ~2008), and an author of a quite successful Polish textbook Programowanie w języku R [26] which was published by PWN (1st ed. 2014, 2nd ed. 2016). Even though the current book is an entirely different work, its predecessor served as an excellent test bed for many ideas conveyed here.
In particular, the teaching style exercised in this book has proven successful in many similar courses that yours truly was responsible for, including at Warsaw University of Technology, Data Science Retreat (Berlin), and Deakin University (Melbourne). I thank all my students and colleagues for the feedback given over the last 15-odd years.
This work received no funding, administrative, technical, or editorial support from Deakin University, Warsaw University of Technology, Polish Academy of Sciences, or any other source.
This book was prepared in a Markdown superset
called MyST,
Sphinx, and
TeX (XeLaTeX).
Code chunks were processed with the R package knitr [65].
All figures were plotted with the low-level graphics package
using the author’s own style template.
A little help from Makefiles, custom shell scripts,
and Sphinx plugins
(sphinxcontrib-bibtex,
sphinxcontrib-proof)
dotted the j’s and crossed the f’s.
The Ubuntu Mono
font is used for the display of code.
The typesetting of the main text relies on the
Alegreya typeface.
You can make this book better
When it comes to quality assurance, open, non-profit projects have to resort to the generosity of the readers’ community.
If you find a typo, a bug, or a passage that could be rewritten or extended for better readability/clarity, do not hesitate to report it via the Issues tracker available at https://github.com/gagolews/deepr. New feature requests are welcome as well.